When Companies Promise a Clinical Trial Result, More Than Half Miss the Date
A study of 681 trials found that the dates companies give for clinical results are usually missed — and when they slip, far more often late than early.
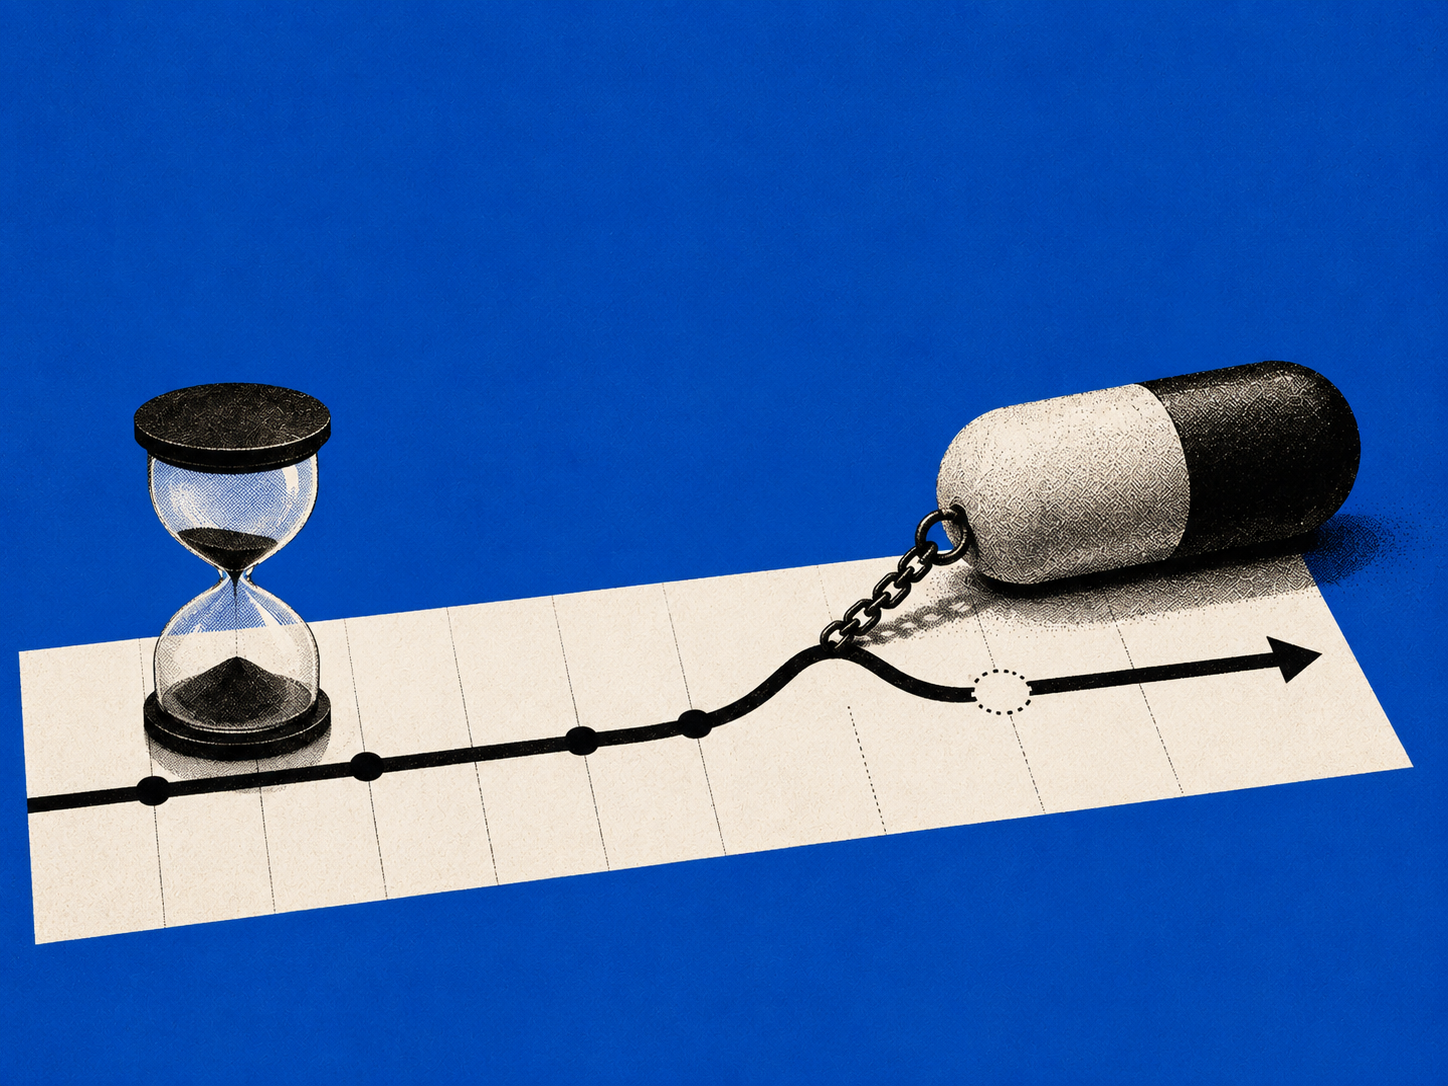
- 58% of 681 trials reported outside the sponsor's promised window — late misses outnumbered early ones nearly 2 to 1 (256 vs. 142).
- Narrower guidance missed more often: a named month was missed 78% of the time, vs. 38% for a full calendar year — but full-year misses overshot by a typical 178 days.
- Oncology was least reliable (31% inside window, ~149 days typical delay); Phase 1 trials fared similarly (36% on time, 52 days late on average). Phase 3 trials landed roughly on schedule.
- Revising the date rarely helped: the error rate stayed between 68–73% across six-plus revisions, and 74% of revisions pushed the date later, typically by ~3 months.
- Timing carried no signal about outcome: late trials met their endpoint 53% of the time vs. 55% for on-time trials — a gap within noise.
- Results released off-market (after close or on a weekend) were ~1.5× more likely to be failures than market-facing releases (27% vs. 17%; χ²=26, p<0.001).
- A model trained only on trial characteristics — never shown the sponsor's own date — beat sponsor guidance: median error of 37 days vs. 80 days, and closer 77% of the time.
When a drug company says a clinical trial will report results "in the third quarter" or "by March," the world takes note. Investors price the moment into a stock. Newsrooms prepare coverage. Doctors and patients read it as a signal of when new evidence might arrive.
All of it rests on a quiet assumption: that a trial expected to report in a given window has a reasonable chance of actually doing so. A new analysis of 681 clinical trials, tracking what sponsors promised against when results actually appeared, finds that assumption is shaky. Fifty-eight percent of trials reported outside the company's final stated window, and when they missed, they were far more likely to be late than early.
The pattern held across nearly every way the data was sliced: the wording of the promise, the disease being treated, the stage of the trial, and the number of times a company revised its own estimate. Optimistic timing, the study concludes, is not a quirk of a few companies. It is a structural feature of how the industry talks about its own schedules. But consistent is not the same as deceptive. Two ordinary forces explain most of it: clinical trials are genuinely hard to time, and public companies face pressure to name a date before the timing is knowable, which tends to make that date an optimistic one.
The direction of the miss
The clearest signal in the data is not just that companies miss, but which way they miss. Of the 398 trials that landed outside their window, 256 came in late and 142 came in early. Guidance leans optimistic, and reality tends to run behind it.
A wider promise hides a bigger delay
The way a company phrases its guidance turns out to matter enormously, but not in the way one might expect. Narrow promises like a named month were missed most often: 78 percent of the time. Broad promises like a full calendar year were missed least. That looks like an argument for vague guidance.
It isn't. A twelve-month window is easy to land inside simply because it is enormous. When companies missed even that generous target, the typical result arrived 178 days past the edge of the promised year. Specificity signals confidence. It does not signal accuracy.
One methodological note, because it matters for reading the chart below: a window is counted as met through its last calendar day, not its first. Guidance for "Q3" is on time through September 30 — a result landing October 1 is a miss by a day, not by a quarter. The same rule applies to every period here: a named month runs through that month's final day, a half-year through its last day, a calendar year through December 31. The miss rates that follow measure distance past that closing date, not past some earlier, stricter mark.
Cancer trials run the latest
No area drifted further from its promises than oncology. Cancer trials reported inside their stated window only 31 percent of the time, and the typical readout landed almost five months late. Some of that is structural: many cancer trials are event-driven, meaning results only mature once a set number of patients experience disease progression or death, thresholds that cannot be scheduled.
By contrast, diseases with fixed follow-up timepoints, like neurology and metabolic conditions, stayed close to schedule. Neurology trials actually reported a touch early on average.
The earlier the trial, the emptier the promise
Guidance was most optimistic in early development. Phase 1 trials, the first tests in humans, reported inside their window just 36 percent of the time and ran a typical 52 days late. Phase 3 trials, with settled protocols and regulatory oversight, came in roughly on time. Early programs simply carry more uncertainty around enrollment, dosing, and cohort expansion, and the dates reflect it.
Revising the date rarely fixes it
Companies update their expected readout as trials go on, and later estimates have the advantage of being made closer to the finish line. But revisions did not steadily improve accuracy. The first estimate was wrong 68 percent of the time; across every subsequent revision, the error rate stayed stuck between 68 and 73 percent, only dropping when measured against the very last date a company gave.
And when companies did revise, they were overwhelmingly moving the date back. Seventy-four percent of revisions pushed the readout later, typically by about three months. A company announcing it is "updating timing" is far more likely to mean a delay than an acceleration.
A delay tells you nothing about the result
It is tempting to read a slipping timeline as a bad omen, a sign the drug isn't working. The data offers no support for that. Trials that reported late met their goals 53 percent of the time; trials that reported on time, 55 percent. Starting from the other end, trials that succeeded and trials that failed were guided with almost identical accuracy. Timing slippage reflects logistics like recruitment, follow-up, and data cleaning, not whether the treatment worked.
Bad news waits for the close.
The date a company promises is made under genuine uncertainty. How and when it releases the answer is made once the result is already in hand — and that is a choice. Timing is the part of it a company fully controls, and timing leaves a hard, objective fingerprint. Across 2,262 trials with a clean win-or-loss outcome, results released outside market hours — after the close or over a weekend, when no trading session can immediately price them — were about 1.5 times as likely to be failures as results released into the open market: 27% versus 17% (χ²=26, p<0.001). Because the release time is a timestamp and the outcome is a separate label, there is no circularity here; it is simply where bad news tends to land. Good news, by contrast, overwhelmingly went out pre-market, where it had a full session to run.
None of this is scandalous. Releasing a weak result after the close is ordinary investor-relations practice, and a public company — the set is about 86% publicly traded — has every reason to do it. It is worth naming precisely because it is the one place in this analysis where being publicly traded, rather than the biology of a trial, most plausibly drives the pattern.
What it means for reading a date
None of this makes sponsor guidance worthless. It makes it an estimate rather than a deadline, and one that leans optimistic for reasons that have little to do with intent. A named month is a narrow target that is easy to check and often broken. A half-year window is easy to satisfy but can hide a long delay. A revision usually means later. And a slipping timeline, whatever it does to a stock price, says almost nothing about whether the science will hold.
The stated date still belongs in the public record. Read it as a forecast, shaped by how hard the trial is to time and the pressure to commit to a number, not as a promise. The one thing a company fully controls is when it chooses to announce, and that choice, unlike the timeline, is worth reading closely.
These patterns surfaced in the course of a larger modeling effort. In building a system to anticipate when trials would actually read out, AppliedXL found that a machine-learning model — trained only on trial-level characteristics, and never shown the sponsor’s own promised date — could forecast readout timing more accurately than the guidance the sponsors issued themselves. On a paired out-of-sample test across the same trials, the model’s median error was 37 days against the sponsors’ 80, and it was the closer of the two estimates 77% of the time — without the systematic optimism that pulls sponsor guidance months early. That a model can out-predict the parties closest to the trial is, in the end, this article’s finding seen from the other side: a promised date carries less information than its specificity implies.
About the data. The analysis tracks trial timing through a single public channel, sponsor press releases, using them as the source for both the promised date and the reported result. Of an initial 1,915 trials, 1,742 carried datable guidance, issued by 719 distinct sponsors, and 681 had guidance on record before results were announced. Subgroup totals may not reconcile with the full sample where phase, therapeutic area, or outcome could not be cleanly classified. Guidance disclosed only through earnings calls, conferences, or filings falls outside the sample. Because the method requires both a promised date and a press-released result, trials that were quietly abandoned, or simply dropped from a sponsor's updates, never enter or resolve, and those skew toward failures. The reported miss rate, optimism, and failure figures are therefore conservative floors: the true numbers are, if anything, larger. A "result" is dated from the first topline press release.
Methods. Guidance dates were issued roughly 2020–2026, a median 13.3 months ahead of the readout; the readouts themselves span 2022–2026, with results captured through the 13 July 2026 data cutoff. Period-based guidance (a named month, quarter, half-year, or calendar year) is evaluated against the last calendar day of the stated period, not the first: a trial guided to "Q3" is on time through September 30. The 719 sponsors in the sample are ~86–96% publicly traded by ticker, so the set is effectively a public-company universe; the ~1,060 trials that carried a promise but were not gradable are not separately characterized. Trials are global (ClinicalTrials.gov registrations), but the disclosure-timing analysis is anchored to US-Eastern market hours, so the market-facing versus off-market split applies to US-listed names.
Outcomes use the production label: a trial "met endpoint" when its primary endpoint was met at pre-specified significance. Of the 681 gradable trials, 432 carry a resolved endpoint label; the ~250 excluded had no clean primary result, interim looks, or event-driven survival not yet mature. The disclosure-timing analysis draws on a larger, separate set: roughly 8,710 readout announcements across ~2,260 labeled trials, reported at the trial level and overlapping the 681-trial timing sample by only about 139, and the off-market versus market-facing failure gap is significant at χ²=26, p<0.001, with 95% confidence intervals shown in Figure 7. That comparison sets a release timestamp against a separate outcome label, so it carries no shared-source circularity.